
The Atlas
Across the Amazon, information about conservation and stewardship is scattered: boundaries live in one spatial dataset, management assessments in an institutional system, and much of what matters most is held locally and never written down at all. The Atlas is the workspace that brings these together, organizing mapped areas, governance systems, stewardship assessments, and regional datasets into a single environment.
It does this by anchoring everything to shared spatial units, so that data developed independently can be connected and analyzed as one system.
A Spatially Integrated System
At its core, the Atlas is structured around areas. Each area acts as a spatial anchor linking four kinds of information:
- designation and legal recognition
- governance systems and actors
- stewardship practices and assessments
- ecological and contextual indicators
Rather than treating maps, assessments, and datasets as separate systems, this structure holds them in one analytical environment — which is what makes it possible to ask how designation relates to stewardship, or how stewardship relates to forest condition.
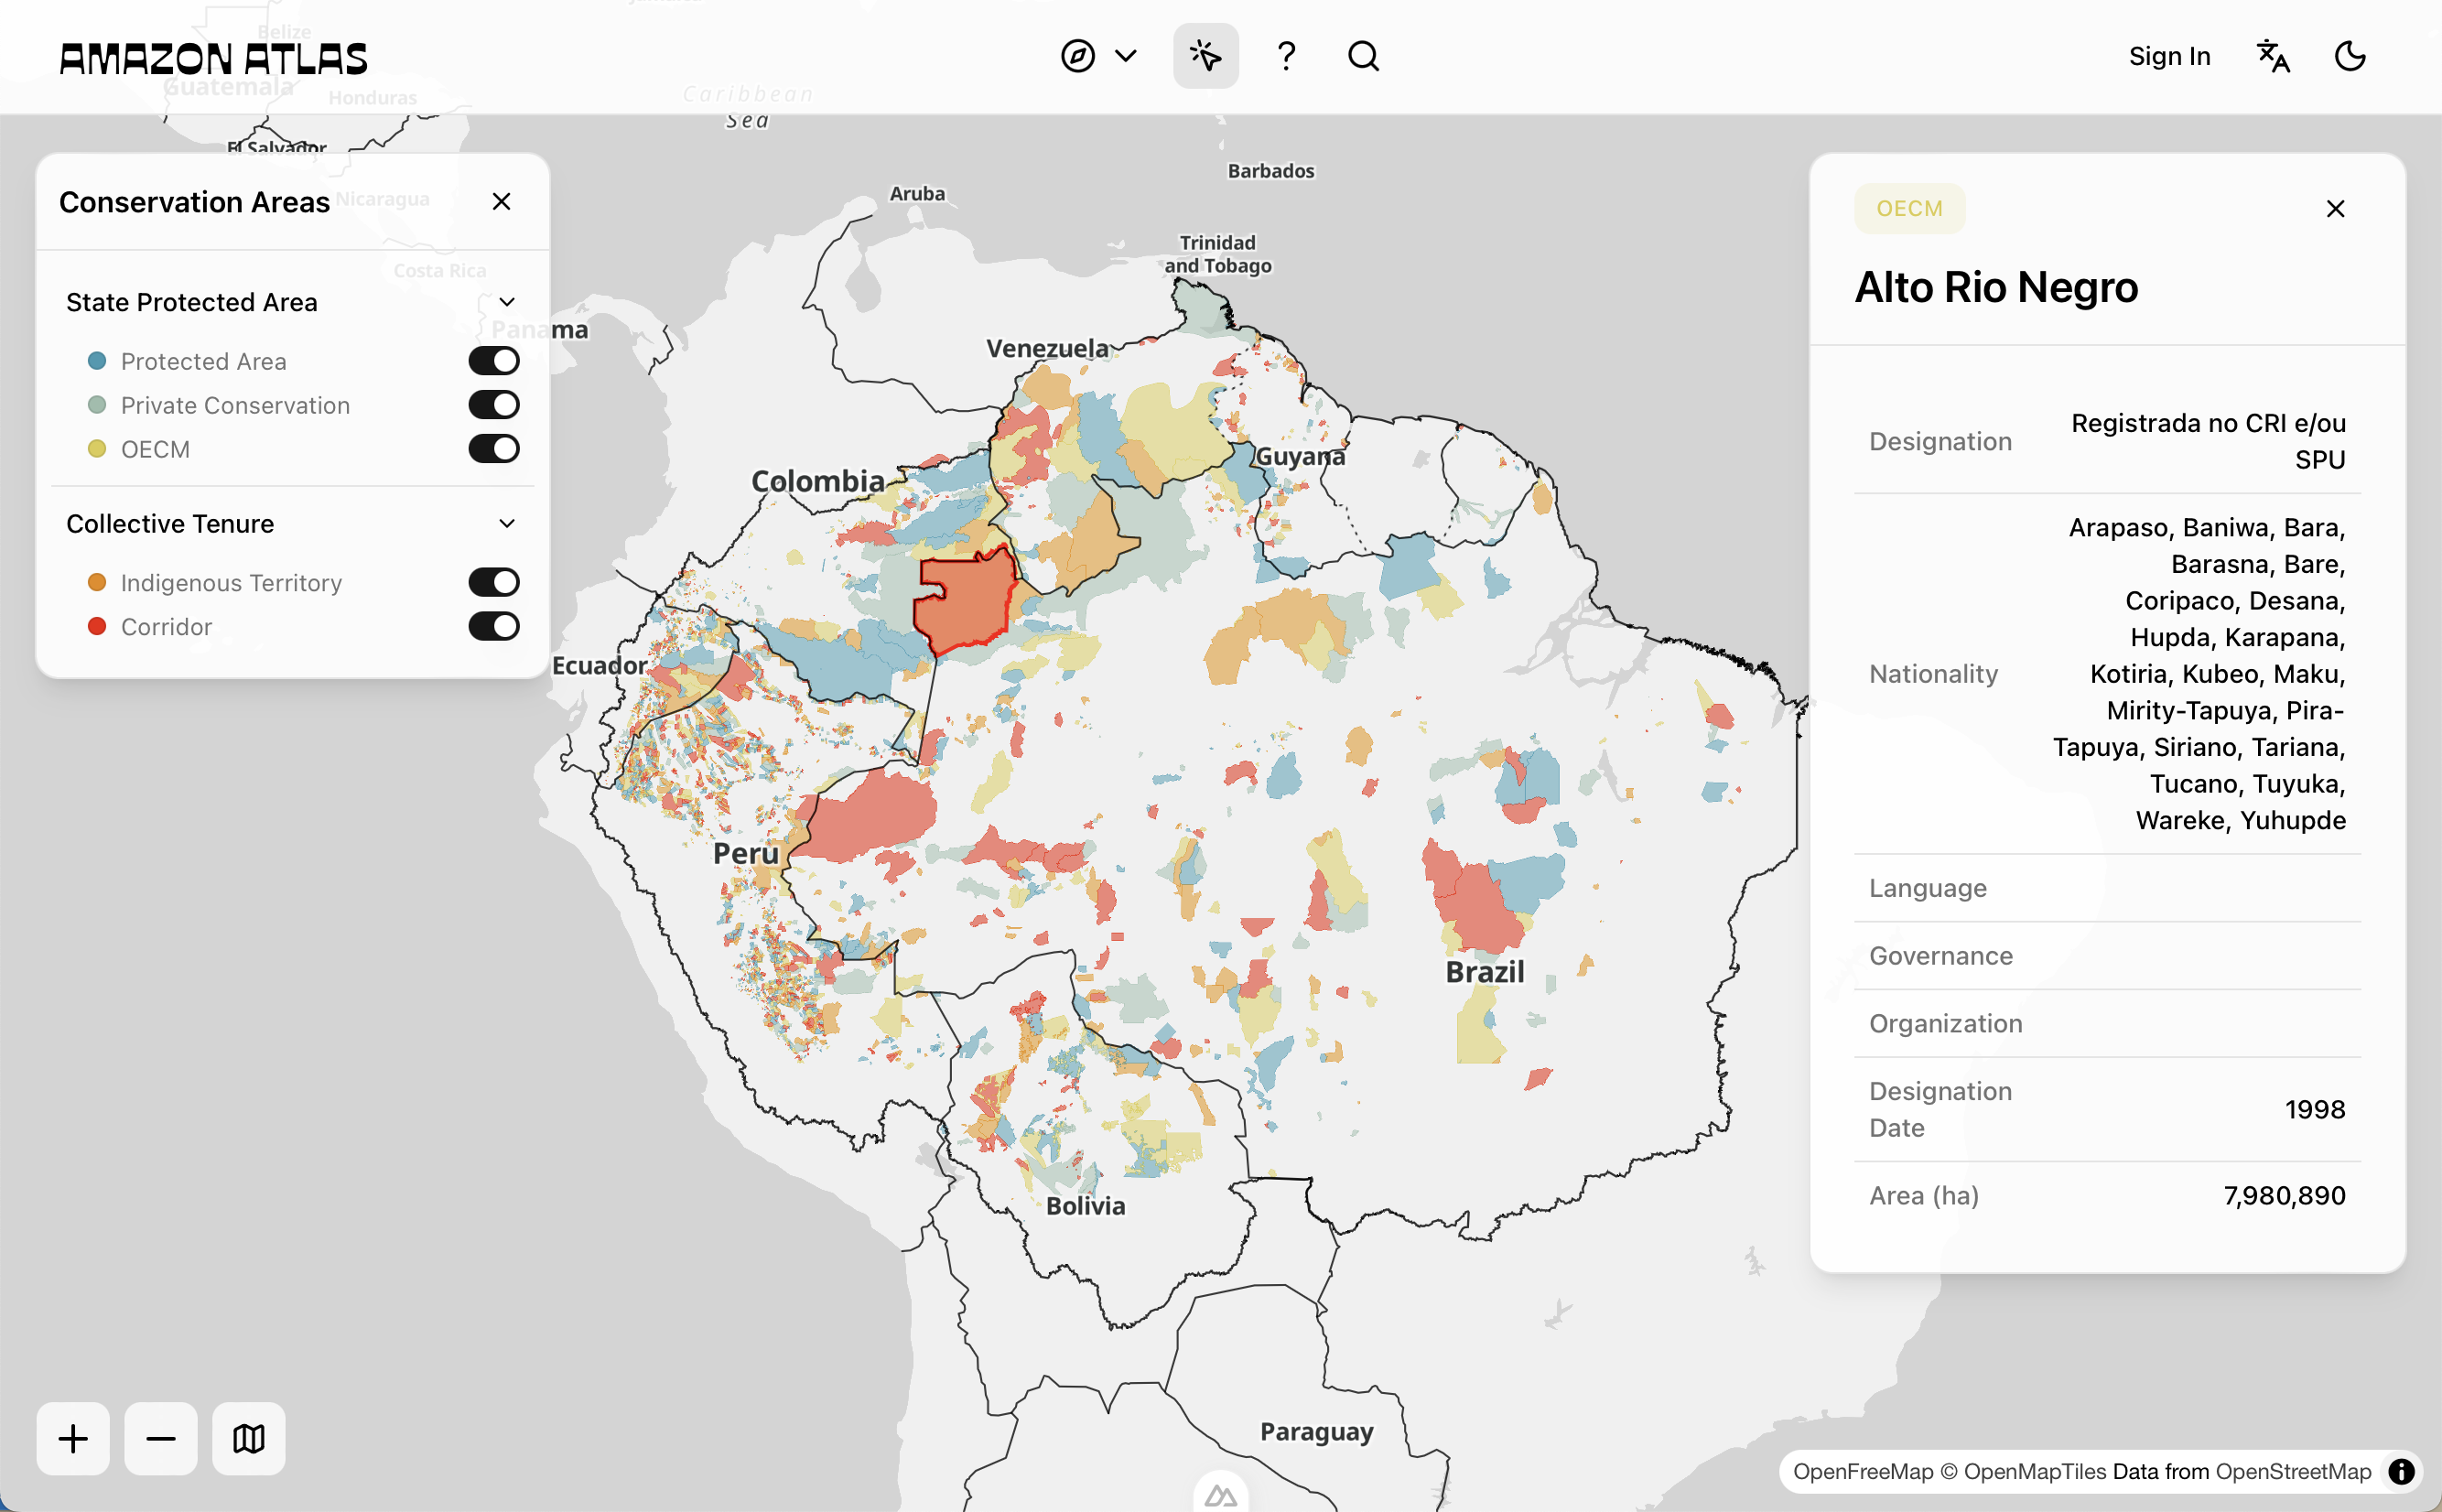
The Atlas in action
Core Components
The interface pairs a continuous spatial view with the structured data behind it.
Map
A continuous spatial view of the Amazon basin showing areas, boundaries, and contextual layers such as forest cover, infrastructure, and environmental pressures. You can move between basin-wide and site-level scales without losing your spatial reference.
Data Panels
Side panels carry the information attached to each area — metadata on designation, governance, and context; stewardship or management assessments; and indicators of resilience, degradation, and pressure. They are what turn a polygon on the map into something you can interpret.
Linking Data
The defining feature of the Atlas is that these different kinds of data share one structure. Spatial data (boundaries and environmental layers), structured metadata (governance, designation, context), assessment frameworks (PAME, CASE), and derived indicators (stewardship, resilience, degradation, pressure) are all joined through consistent identifiers.
That consistency is what lets you trace an indicator back to the data it was built from, compare areas across governance systems, and bring local and regional knowledge into the same view.
Analysis Support
Because the data is linked rather than merely co-located, the Atlas supports analysis well beyond static mapping. You can examine how governance systems are distributed across the Amazon, how designation relates to stewardship in practice, how areas compare on standardized indicators, and how pressures and ecological conditions vary across landscapes.
This is the shift the platform is built around: from mapping areas to understanding how they function over time.
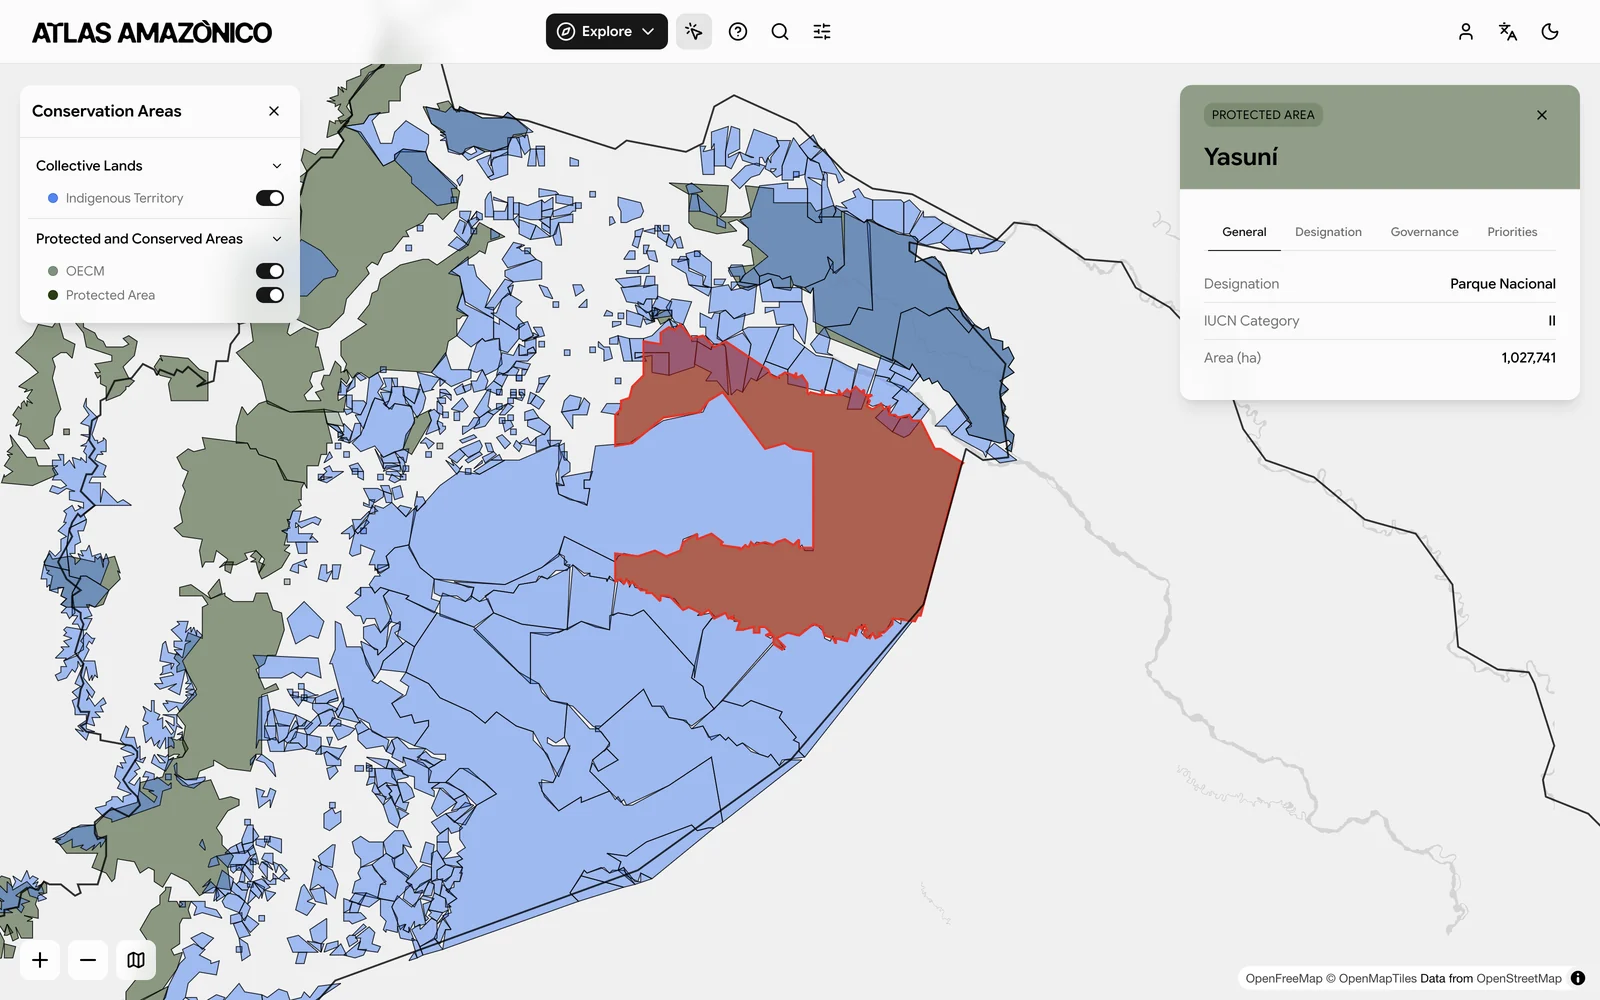 A selected area with its metadata panel, where Designation, Governance, and Priorities each have their own tab
A Shared Workspace
The Atlas is built for several audiences working across the Amazon at once, each bringing something different to it:
- Indigenous peoples and local communities document governance and stewardship
- Protected area managers assess management effectiveness
- Researchers analyze spatial and governance data
- Governments monitor conservation systems
- Funders and practitioners track outcomes and prioritize action
A shared infrastructure lets these groups work from the same base while keeping enough flexibility for very different contexts.
A Living System
The Atlas is not a finished dataset. It is updated continuously through contribution, validation, and use, and it improves along several fronts at once: spatial coverage becomes more complete, metadata more refined, assessments more comparable, and indicators more robust. That is deliberate, because the stewardship systems it describes are themselves always changing.